ID3D12CommandQueue::UpdateTileMappingsが起こすデッドロックについて
Deadlocks Caused by ID3D12CommandQueue::UpdateTileMappings
English is here. Deadlocks Caused by ID3D12CommandQueue::UpdateTileMappings
D3D12のゲームが低い頻度でハングアップしてしまう理由の一つとして、UpdateTilemappnigsが原因となるデッドロックがあります。詳しい仕組みは、いまだ不明ですが、最近やっと自分の考えを人に説明できるぐらいにはなってきたので、メモ代わりに残しておこうと思います。
ただし、以下に記述することは、あくまでも、おそらくこういうことだろうなぁ、という程度の想像の話です。確かなことはSDKやOSを設計している人に聞いてみないとわかりません。
今のところ、Windows11 24H2 (OS Build 26100.2894)では起きるようですが、将来的にOS側に修正が入る可能性もあるかと思います。
GPUViewで確認するD3D12のID3D12CommandQueue::UpdateTileMappingsの動作
まずは、GPUViewを使ってUpdateTileMappingsの動作を確認してみます。GPUViewのEvent Listの中から、DxgKrnl UpdateGPUVirtualAddressを選択して、呼び出し箇所を特定します。
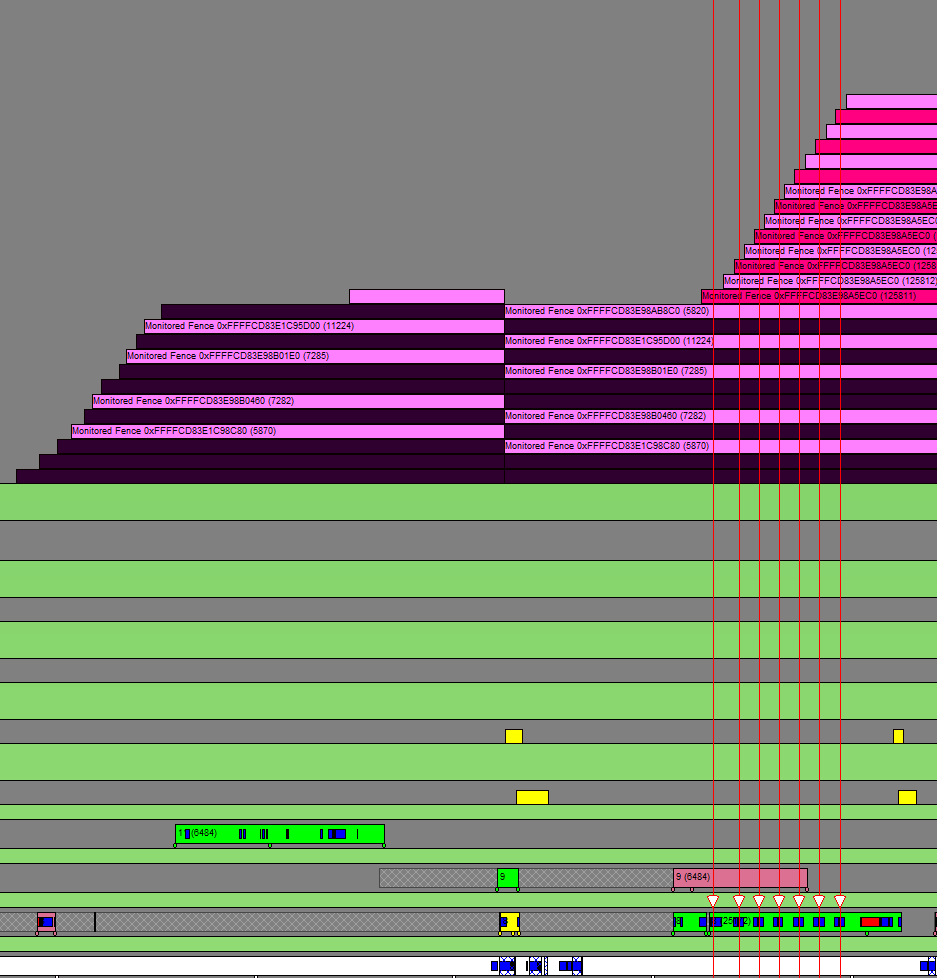
以下のスクリーンショットは、あるフレームのレンダリング処理を、プロセスのGPU実行キューに積んだ後に、UpdateTileMappings(以下UTM)を何度か呼び出している箇所です。
UTMの呼び出しで、アプリケーションのスレッドがカーネルモードにスイッチしているのがわかります。また、その区間では、DxgKrnl UpdateGPUVirtualAddressのイベント一つにつき、フェンスが二つ設定されているのがわかります。
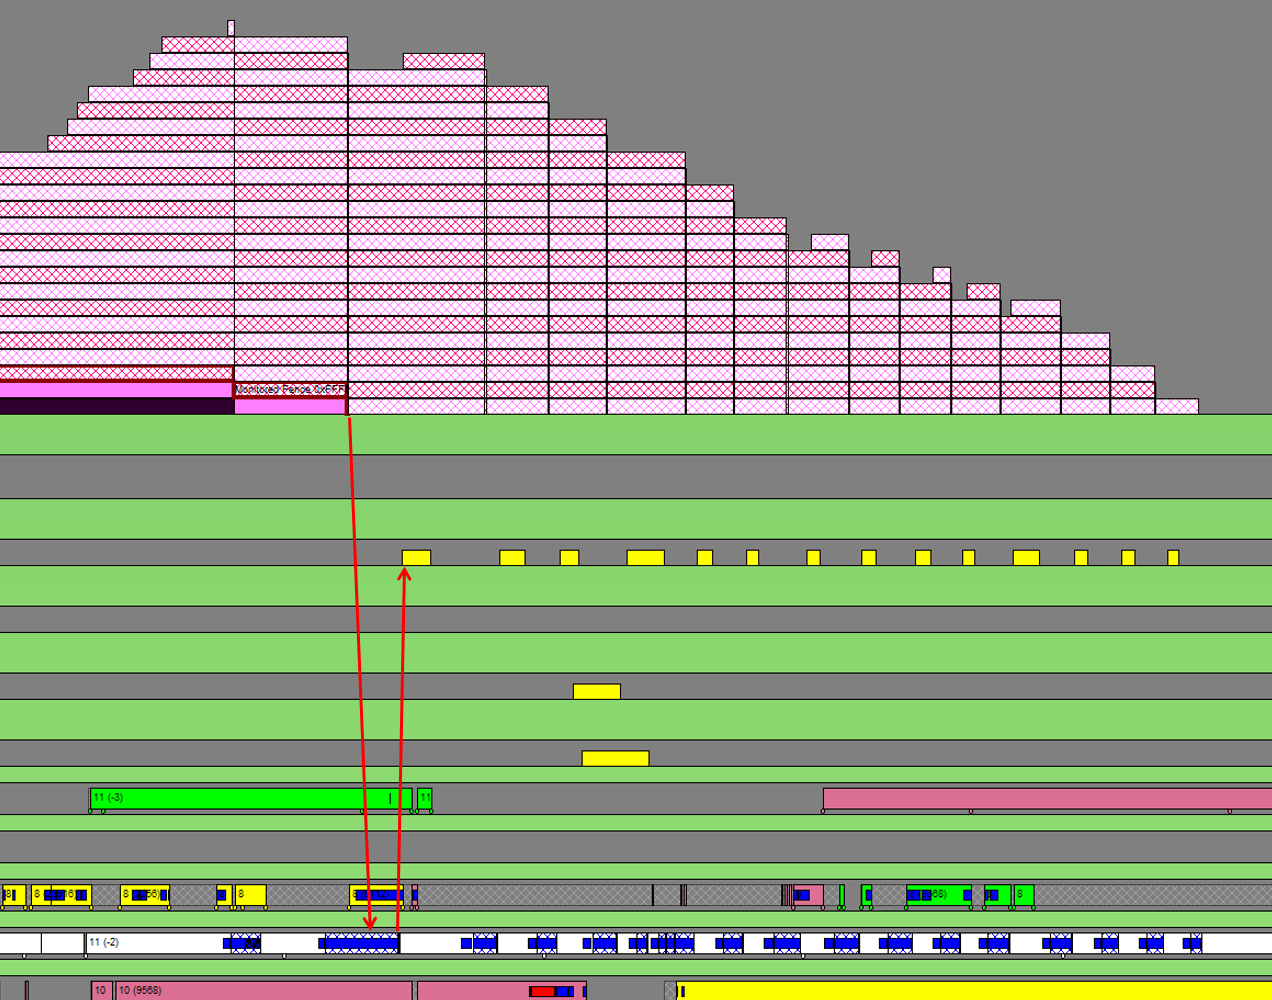
次に、このフェンスがプロセスのGPU実行キューで処理されるタイミングを見てみます。まず、積み上げられたフェンスは同一のオブジェクトなのがわかります。1つのフェンスが、フェンス値をインクリメントしながら使用されているようです。UTMのフェンスが、プロセスのGPU実行キューの先頭に到達すると、アプリケーションのスレッドでDPCが呼び出されます(これはOSによる割り込みと解釈して問題ありません。)このDPCは、プロセスのPaging QueueにPaging Queu Packetを送出します。
以下のスクリーンショットでは、UTMが送出した一連のフェンスをハイライトしています。先頭が、実行キューの先頭に到達する直前で、アプリケーションの白いバーで示されているThread上で、DPCが起動されます。このDPCが動作するタイミングでPaging Queue Packetが送出されますようです。矢印で図示しておきました。
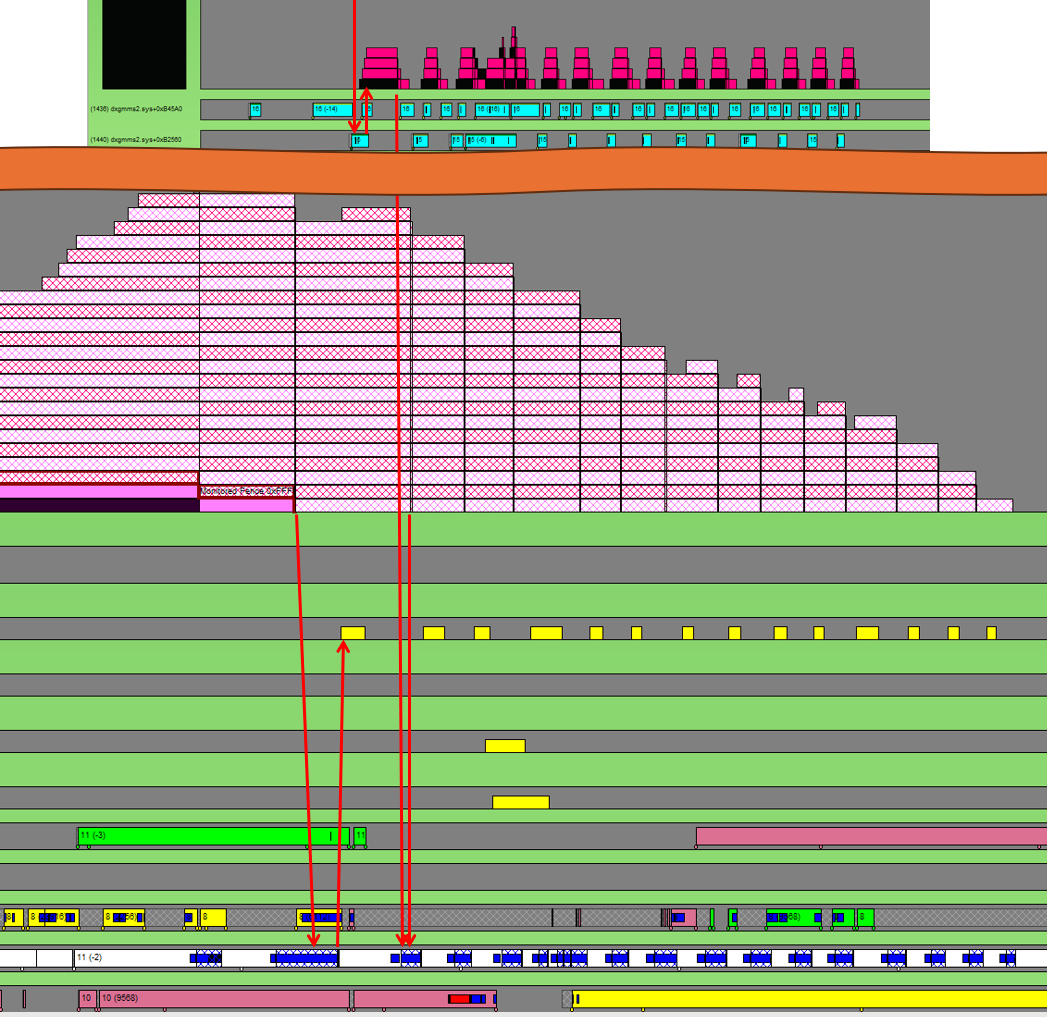
送出されたPaging Queue Packetは、OSのVidMm WorkerThreadで処理されます。パケットを受け取ったOSのスレッドが、System Paging Contextに、Paging Command Packetを送出します。このパケットは、GPU上のHardware Copy Queueに送出されて、GPU上で処理されます。
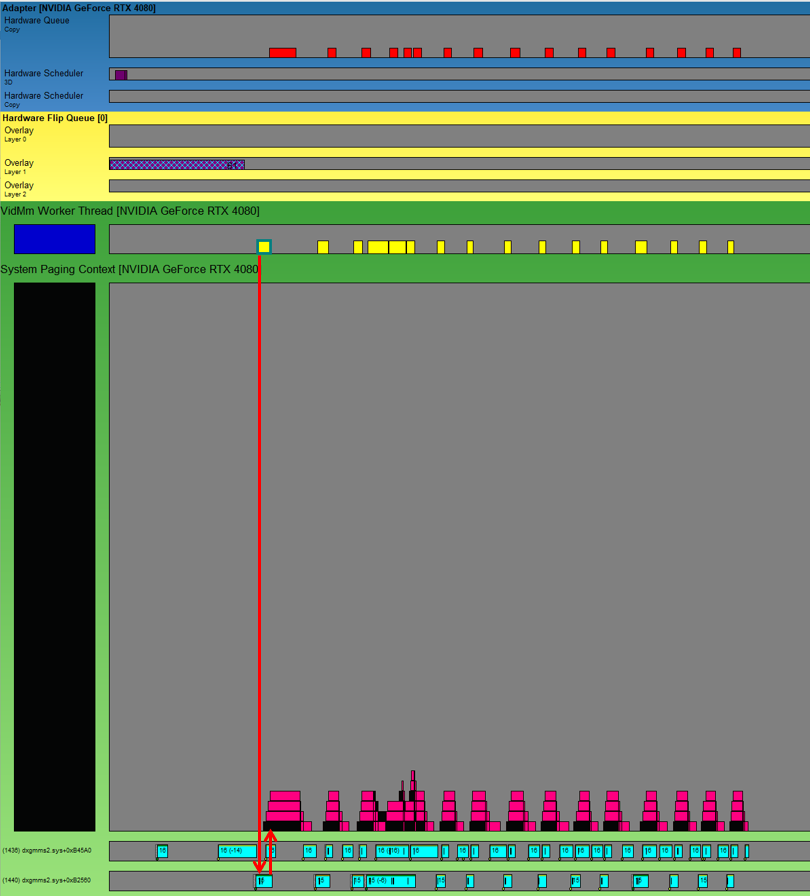
System Paging Contextには、Paging Command Packetの直後に、3つのフェンスが設定されており、GPU上でのUTM処理の完了をCPU側で検知するようです。このうちの一つは、UTMを送出したプロセスのスレッドでDPCを起動して、これがUTMのフェンスのフェンス値をインクリメントするようです。その結果、プロセス側のGPU実行QueueでUTMの完了を待っていたフェンスが解決されます。これで一つのUTM処理が完了したことになります。
UTMの処理をWindbgで追ってみる
次は、デバッガーを使って、UTMの処理を追ってみます。適当なサンプルアプリケーションのUTMコールを、Microsoftのシンボルサーバーだけを使って追ってみました。処理は、D3Dのランタイム、ユーザーモードドライバー、Windows APIなどで構成されており、その中で主だった処理を、順を追って見てみたいと思います。
1. D3D12Coreが管理するMutexの取得
UTM呼び出しの冒頭で、D3D12Coreが管理するミューテックスを取得します。おそらくこれは、該当のCGraphicsCommandQueueに対する呼び出しの、排他制御の為と思われます。CGraphicsCommandQueueはスレッドセーフな設計となっているので、必要に応じてD3Dのランタイム側でで排他制御が行われているのだと思われます。
[0x0]   ntdll!RtlAcquireSRWLockExclusive
[0x1]   msvcp_win!Mtx_lock+0x31
[0x2]   D3D12Core!std::_Mutex_base::lock+0x10
[0x3]   D3D12Core!CGraphicsCommandQueue::UpdateTileMappings+0xe2
2. Device Driver Interfaceに登録された関数の呼び出し
Device Driver Interface (DDI)は、OSやランタイムが、デバイスドライバーを呼び出すときの関数のインターフェースです。呼び出し先は、その時インストールされているドライバーのコードになります。呼び出されたDDIの引数のを見ると、d3d12umddi.hに定義されている、PFND3D12DDI_UPDATETILEMAPPINGSだとわかります。
[0x2]   D3D12Core!TableFunctionTraits<2>::Detail::InvokerImpl<TableFunctionTraitsImpl<2>::FunctionTraits<70,0,void>,void,void,D3D12DDI_HCOMMANDQUEUE,D3D10DDI_HRESOURCE,unsigned int,D3D12DDI_TILED_RESOURCE_COORDINATE const * __ptr64,D3D12DDI_TILE_REGION_SIZE const * __ptr64,D3D12DDI_HHEAP,unsigned int,enum D3D12DDI_TILE_RANGE_FLAGS const * __ptr64,unsigned int const * __ptr64,unsigned int const * __ptr64,enum D3D12DDI_TILE_MAPPING_FLAGS>::Call<CGraphicsCommandQueue>+0x9f
[0x3]   D3D12Core!CGraphicsCommandQueue::UpdateTileMappings+0x15e
参考:d3d12umddi.hのPFND3D12DDI_UPDATETILEMAPPINGSの定義
typedef VOID ( APIENTRY* PFND3D12DDI_UPDATETILEMAPPINGS )( D3D12DDI_HCOMMANDQUEUE, D3D12DDI_HRESOURCE,
    UINT NumTiledResourceRegions,
    _In_reads_(NumTiledResourceRegions) const D3D12DDI_TILED_RESOURCE_COORDINATE* pResourceRegionStartCoords,
    _In_reads_opt_(NumTiledResourceRegions) const D3D12DDI_TILE_REGION_SIZE* pResourceRegionSizes,
    D3D12DDI_HHEAP, UINT NumRanges,
    _In_reads_opt_(NumRanges) const D3D12DDI_TILE_RANGE_FLAGS*,
    _In_reads_opt_(NumRanges) const UINT* pHeapStartOffsets,
    _In_reads_opt_(NumRanges) const UINT* pRangeTileCounts,
    D3D12DDI_TILE_MAPPING_FLAGS );
3. UMDのコード内でのCritical Sectionの取得
Critical SectionはWindwosが提供するる、プロセス内で使える同期オブジェクトです。Callstackを見ると、UMDのコードがnvwgf2umx!OpenAdapterとなっていますが、これは、UMDのDLLでExportされているSymbolからのオフセットアドレスを表示しているだけで、DDIコールでOpenAdapterが呼ばれているわけではありません。NVIDIAのUMDのDLLのPDBファイルが無いので、Symbolが解決できないだけです。
[0x0]   ntdll!RtlEnterCriticalSection
[0x1]   nvwgf2umx!OpenAdapter12+0x7e5f
[0x2]   D3D12Core!TableFunctionTraits<2>::Detail::InvokerImpl<TableFunctionTraitsImpl<2>::FunctionTraits<70,0,void>,void,void,D3D12DDI_HCOMMANDQUEUE,D3D10DDI_HRESOURCE,unsigned int,D3D12DDI_TILED_RESOURCE_COORDINATE const * __ptr64,D3D12DDI_TILE_REGION_SIZE const * __ptr64,D3D12DDI_HHEAP,unsigned int,enum D3D12DDI_TILE_RANGE_FLAGS const * __ptr64,unsigned int const * __ptr64,unsigned int const * __ptr64,enum D3D12DDI_TILE_MAPPING_FLAGS>::Call<CGraphicsCommandQueue>+0x9f
[0x3]   D3D12Core!CGraphicsCommandQueue::UpdateTileMappings+0x15e
4. フェンスのシグナルの送出
次に、UMDのUTM処理コードは、D3DCoreの、SubmitSignalSyncObjectsToHwQueueCBを呼び出します。このコールバックは、OSがD3DRuntimeに登録するコールバックと思われます。登録されているコールバック関数は、win32u!NtGdiDdDDISubmitSignalSyncObjectsToHwQueueのようです。この関数のアセンブラコードを見ると、すぐにsyscallを実行して、カーネルモードに入っています。ここまでの呼び出し経路は少々複雑で、Application→D3DRuntime→UMD→D3DRuntime→GDIとなっています。
[0x0]   win32u!NtGdiDdDDISubmitSignalSyncObjectsToHwQueue+0x12
[0x1]   D3D12Core!CallAndLogImpl<long (__cdecl*)(_D3DKMT_SUBMITSIGNALSYNCOBJECTSTOHWQUEUE const * __ptr64),_D3DKMT_SUBMITSIGNALSYNCOBJECTSTOHWQUEUE * __ptr64>+0x1d
[0x2]   D3D12Core!NDXGI::CDevice::SubmitSignalSyncObjectsToHwQueueCB+0xdd
[0x3]   nvwgf2umx!....
....
[0xa]   nvwgf2umx!....
[0xb]   D3D12Core!TableFunctionTraits<2>::Detail::InvokerImpl<TableFunctionTraitsImpl<2>::FunctionTraits<70,0,void>,void,void,D3D12DDI_HCOMMANDQUEUE,D3D10DDI_HRESOURCE,unsigned int,D3D12DDI_TILED_RESOURCE_COORDINATE const * __ptr64,D3D12DDI_TILE_REGION_SIZE const * __ptr64,D3D12DDI_HHEAP,unsigned int,enum D3D12DDI_TILE_RANGE_FLAGS const * __ptr64,unsigned int const * __ptr64,unsigned int const * __ptr64,enum D3D12DDI_TILE_MAPPING_FLAGS>::Call<CGraphicsCommandQueue>+0x9f
[0xc]   D3D12Core!CGraphicsCommandQueue::UpdateTileMappings+0x15e
参考:NtGdiDdDDISubmitSignalSyncObjectsToHwQueueのアセンブラコード
win32u!NtGdiDdDDISubmitSignalSyncObjectsToHwQueue:
mov     r10, rcx
mov     eax, 125Dh
test    byte ptr [7FFE0308h], 1
jne     win32u!NtGdiDdDDISubmitSignalSyncObjectsToHwQueue+0x15
syscall
ret
5. D3DKMT_UPDATEGPUVIRTUALADDRESSの呼び出し
ついにUTMの処理の本体とも呼べる箇所に到達しました。呼び出し経路は、先ほどのシグナルと似た経路です。こちらもGDIの関数で、関数内部で、すぐにsycallを実行するだけです。処理の実体はカーネルモードにあると思います。
[0x0]   win32u!NtGdiDdDDIUpdateGpuVirtualAddress+0x12
[0x1]   D3D12Core!CallAndLogImpl<long (__cdecl*)(_D3DKMT_UPDATEGPUVIRTUALADDRESS const * __ptr64),_D3DKMT_UPDATEGPUVIRTUALADDRESS * __ptr64>+0x11
[0x2]   D3D12Core!NDXGI::CDevice::UpdateGpuVirtualAddressCB+0x64
[0x3]   nvwgf2umx!....
....
[0x8]   nvwgf2umx!....
[0x9]   D3D12Core!TableFunctionTraits<2>::Detail::InvokerImpl<TableFunctionTraitsImpl<2>::FunctionTraits<70,0,void>,void,void,D3D12DDI_HCOMMANDQUEUE,D3D10DDI_HRESOURCE,unsigned int,D3D12DDI_TILED_RESOURCE_COORDINATE const * __ptr64,D3D12DDI_TILE_REGION_SIZE const * __ptr64,D3D12DDI_HHEAP,unsigned int,enum D3D12DDI_TILE_RANGE_FLAGS const * __ptr64,unsigned int const * __ptr64,unsigned int const * __ptr64,enum D3D12DDI_TILE_MAPPING_FLAGS>::Call<CGraphicsCommandQueue>+0x9f
[0xa]   D3D12Core!CGraphicsCommandQueue::UpdateTileMappings+0x15e
参考:NtGdiDdDDIUpdateGpuVirtualAddressのアセンブラコード
win32u!NtGdiDdDDIUpdateGpuVirtualAddress:
mov     r10, rcx
mov     eax, 1264h
test    byte ptr [7FFE0308h], 1
jne     win32u!NtGdiDdDDIUpdateGpuVirtualAddress+0x15 (7ff81e415f15)
syscall
ret
6. フェンスのウエイトの設定
D3DKMT_UPDATEGPUVIRTUALADDRESSが呼ばれた後に、フェンスのウエイトの設定処理があります。私の環境では複数回呼び出されていました。こちらも、GDI関数で処理され、処理の本体は、カーネルモードで実行されています。
[0x0]   win32u!NtGdiDdDDISubmitWaitForSyncObjectsToHwQueue+0x12
[0x1]   D3D12Core!CallAndLogImpl<long (__cdecl*)(_D3DKMT_SUBMITWAITFORSYNCOBJECTSTOHWQUEUE const * __ptr64),_D3DKMT_SUBMITWAITFORSYNCOBJECTSTOHWQUEUE * __ptr64>+0x1d
[0x2]   D3D12Core!NDXGI::CDevice::SubmitWaitForSyncObjectsToHwQueueCB+0x4d
[0x3]   nvwgf2umx!...
...
[0xa]   nvwgf2umx!...
[0xb]   D3D12Core!TableFunctionTraits<2>::Detail::InvokerImpl<TableFunctionTraitsImpl<2>::FunctionTraits<70,0,void>,void,void,D3D12DDI_HCOMMANDQUEUE,D3D10DDI_HRESOURCE,unsigned int,D3D12DDI_TILED_RESOURCE_COORDINATE const * __ptr64,D3D12DDI_TILE_REGION_SIZE const * __ptr64,D3D12DDI_HHEAP,unsigned int,enum D3D12DDI_TILE_RANGE_FLAGS const * __ptr64,unsigned int const * __ptr64,unsigned int const * __ptr64,enum D3D12DDI_TILE_MAPPING_FLAGS>::Call<CGraphicsCommandQueue>+0x9f
[0xc]   D3D12Core!CGraphicsCommandQueue::UpdateTileMappings+0x15e
win32u!NtGdiDdDDISubmitWaitForSyncObjectsToHwQueue:
mov     r10, rcx
mov     eax, 125Eh
test    byte ptr [7FFE0308h], 1
jne     win32u!NtGdiDdDDISubmitWaitForSyncObjectsToHwQueue+0x15 (7ff81e415e55)
syscall
ret
7. UMDのコードで取得したCritical Sectionの解放
冒頭で、UMDが取得したCritical Sectionをリリースしています。
[0x0]   ntdll!RtlLeaveCriticalSection
[0x1]   nvwgf2umx!...
[0x2]   D3D12Core!TableFunctionTraits<2>::Detail::InvokerImpl<TableFunctionTraitsImpl<2>::FunctionTraits<70,0,void>,void,void,D3D12DDI_HCOMMANDQUEUE,D3D10DDI_HRESOURCE,unsigned int,D3D12DDI_TILED_RESOURCE_COORDINATE const * __ptr64,D3D12DDI_TILE_REGION_SIZE const * __ptr64,D3D12DDI_HHEAP,unsigned int,enum D3D12DDI_TILE_RANGE_FLAGS const * __ptr64,unsigned int const * __ptr64,unsigned int const * __ptr64,enum D3D12DDI_TILE_MAPPING_FLAGS>::Call<CGraphicsCommandQueue>+0x9f
[0x3]   D3D12Core!CGraphicsCommandQueue::UpdateTileMappings+0x15e
8. D3DCoreのMutexの解放
冒頭で、D3DRuntimeが取得したMutexをリリースしています。
[0x0]   ntdll!RtlReleaseSRWLockExclusive   0xc9a75ffd18   0x7ff81e8a366b
[0x1]   msvcp_win!Mtx_unlock+0x1b   0xc9a75ffd20   0x7fff94976bd8
[0x2]   D3D12Core!CGraphicsCommandQueue::UpdateTileMappings+0x168   0xc9a75ffd50   0x7ff6e60e183d
Windbgで確認できるUTMの動作のまとめ
- CommandQueueごとの排他制御と思われるMutex(D3DRuntime管理)を取得している。
- UMDのコード内でCritical Sectionを取得している。(これはGPUやドライバーによって異なる可能性がある)
- 以下のGDI関数を呼び出している(いずれも処理の本体はカーネルモード)
- NtGdiDdDDISubmitSignalSyncObjectsToHwQueue
- NtGdiDdDDIUpdateGpuVirtualAddress
- NtGdiDdDDISubmitWaitForSyncObjectsToHwQueue
D3DKMTUpdateGpuVirtualAddressの仕様について
上記のページのRemarksの最後の部分に、重要なことが記述されています。
ドライバーは多くのUpdateGpuVirtualAddress呼び出しを送信できますが、それはレンダリングフェンスの後ろにキューイングされます。 キューイングされた更新操作の数が128を超えると、呼び出し元のスレッドはビデオメモリマネージャーによって以前の操作が処理されるまでブロックされます。
つまり、UTMはID3D12CommandQueueのメソッドなので、大量のUTM処理を発行したとしても、それはCommandQueueに蓄積されるだけではないかと我々は想像してしまいますが、実際は、最大で128リクエストしか蓄積することができず、これを超えると、前に発行したUTMが完了するまで処理がブロックされるということがこのドキュメントから分かります。
UTMのデッドロック条件
UTMのデッドロックは、おそらく先ほど説明した、128以上のUTM処理の蓄積によっておこるUTM処理のブロッキングに起因するものと思われます。このブロッキングの解消には、前に発行したUTM処理がGPU上で完了する必要があります。
UTMは、ID3D12CommandQueueのメソッドなので、UTMの直前までに実行キューに積まれたすべての処理が完了し、UTM処理を開始するためのフェンスがシグナルされるまで処理は開始されません。もしも、UTMを実行キューに積む前にフェンスのウエイトが設定されて、それが解決しない状況に陥ればデッドロックになることが予想されます。
しかし、一般的に、フェンスが解決しない状況はUTMの動作とは関係なくデッドロック状態に陥るので、UTM特有の問題とは言えません。では、何がUTM特有なのかというと、UTM処理のブロッキング、つまり前に発行したUTMの処理完了待ちをどこで行っているかというところです。
これは、UTMデッドロックに陥っているプロセスのメモリダンプを見るとわかるのですが、UTMのブロッキングは、win32u!NtGdiDdDDIUpdateGpuVirtualAddress 内のsyscallの箇所、つまりカーネル空間の処理の最中に行われます。
先の章で、WinDbgでUTMの処理をトレースした際に確認しましたが、この箇所に到達するまでに、D3D12Coreにあるミューテックスを取得して、UMDの中でCiritical Sectionを取得しています。他にも、GDIレイヤーのカーネル空間でも排他処理が行われているかもしれません。もしも、これらの排他処理が、UTMより先に設定されたウエイトをシグナルするために必要な処理をブロックした場合はデッドロックが成立します。
そんなことが実際に起きるのか?と疑問に思うのは自然なことだと思います。しかし次の章で、UMTブロッキング時に競合する他のAPIのリストを見れば納得できると思います。
UTMの排他リソースと競合する処理
では、UTMブロッキング時に競合する他の処理を見てみましょう。
D3DCoreのミューテックスとUMDのCritical Sectionは、デバッガで追えば競合している状況を確認できます。しかし、複数のUTMデッドロックを起こしたプロセスのメモリダンプを確認すると、どうやらカーネル空間で処理が行われているGDI関数の方にも排他処理が存在するようです。
ここでは、UTMのデッドロックが発生しているプロセスのメモリダンプでよく観測される箇所、つまり、UTMブロッキングで処理が停止する可能性の高い処理をリストアップしたいと思います。
ID3D12CommandQueue::ExecuteCommandLists
私の経験上、最もよく見かけます。
D3DCoreの中で、ミューテックスを取得しようとして失敗するため、NtWaitForAlertByThreadId でスリープして待機状態に入っています。
このミューテックスがUTMが確保したものならば、おそらく同じコマンドキューに対するECLなので、ミューテックスの取得に失敗して待機するのは納得がいきます。しかし、この処理は、UTMの後にキューに積まれるべき処理のはずなので、UTMデッドロックの直接の原因にはならないでしょう。
ID3D12CommandQueue::Signal
Signalは、D3DCoreから、直接Win32uのNtGdiDdDDISubmitSignalSyncObjectsToHwQueue を呼び出し、syscallの中で止まっているのを観測します。
私の考えでは、UTMのキューに設定されたウエイトをシグナルするための、他のキューに設定されるべきシグナルが設定できないためにデッドロックが発生します。
したがって、シグナルを呼んでいるスレッドがsyscallの中で止まっているというのは、大変興味深いです。
ID3D12Fence::SetEventOnCompletion
この処理は、D3D12Core!CFence::SetEventOnCompletionから、D3D12Core!CDevice::SetEventOnMultipleFenceCompletionというメソッドを呼んでいるので、API上は、ID3D12Fenceですが、実質上は、ID3D12Deviceの処理だと考えたほうがよさそうです。
最終的には、NtGdiDdDDIWaitForSynchronizationObjectFromCpu を呼び出し、syscallの中で止まっているのを観測します。
ID3D12Device::CreatePlacedResource
このメソッドは、私の環境では、UMDから、D3D12Core!NDXGI::CDevice::UpdateGpuVirtualAddressCBを呼び出し、最終的には、NtGdiDdDDIUpdateGpuVirtualAddressを呼び出しています。
途中から、ID3D12CommandQueue::UpdateTileMappingsと同じコードパスを辿ります。UTMと同じカーネル呼び出しですので、競合するのは理解ができます。
ID3D12Fence::Release()
観測した中で、最も意外だったのが、フェンスオブジェクトの解放処理である、Release()です。この処理は最終的に、NtGdiDdDDIDestroySynchronizationObjectを呼び出しているのですが、この関数のsyscallで止まっているのが複数回観測できました。
UTMデッドロックの回避方法
まとめです。D3D12のAPIのユーザーとして、どのようなことに気を付ければ、UTMデッドロックを回避できるのでしょうか。
プログラム側で、UTMの発行回数を制限する
いろいろと考えられますが、最も効果的な方法を一つだけ提案します。それは、UTMの発行数をアプリ側で監視して制御する方法です。
具体的な方法は、UTM専用のスレッド、UTM専用のCopyQueue、UTM専用のフェンスを用意して、UTMの呼び出しごとに、シグナルを設定して、フェンス値をインクリメントします。そして、UTMを呼び出す前に、GetCompletedValue()でGPU側での完了状況をチェックして、128個以上キューに積まれそうな状況では、SetEventOnCompletion()を使って、先に発行されたUTMの完了を待ちます。こうして、128個以上UTMがコマンドキューに積みあがらないようににプログラム側で調整します。GraphicsQueueや、ComputeQueueとの同期が必要な場合は、随時UTM専用のCopyQueueとフェンスを設定して同期します。
なぜ専用のスレッドを用意するのか
まず、SetEventOnCompletion()で、スレッドを待機させなければならない状況も考えられるので、専用のスレッドを用意するのは自然な考えです。
加えて、UTMの呼び出しは、もともとCPU側のフェンス処理を伴います。GPU Viewで観測したとおり多数のDPCコールが発生することが予想されます。これらは、UTMのスレッドからCPU時間を奪い取り、L1キャッシュの状態を乱す可能性があります。ならば、UTMの呼び出し元はUTMの処理に特化し、単純な処理をするスレッドにしておくべきです。
なぜ専用のCopyQueueを用意するのか
専用のCopyQueueを使う第一の理由は、UTMの個数を正確に数えるためです。UTMブロッキングの128という条件は、コマンドキューごとの数で、プロセス内で発行された総数ではありません。極端な話をすれば、コマンドキューを二つ用意して、UTMを分散すると、256個までUTMを発行できます。
専用のキューを用意してフェンスで他のキューと同期をとるのは、一見するとオーバーヘッドの高い処理に感じるかもしれません。しかし、UTMの処理は、もともとOSのメモリマネージャーによる処理を伴い、フェンスでUTMの発行されたキューと同期をとっています。つまり、もともとオーバーヘッドの高い処理なのです。
他のGraphicsQueueやComputeQueueとフェンスで同期すれば、結局それらのキューはUTMのキューを待つことになり、全体の実行スピードは変わらないかもしれません。しかし、GraphicsQueueやComputeQueueがUTMのキューを長時間待つのを観測できれば、UTMと同期するフェンスの位置を調整したり、他の依存関係のない処理を挿入したりして最適化を行うことができます。ちなみに、UTMの処理は、GPU上ではHWCopyQueue上で非常に短時間に処理されます。つまり、UTM処理中は、GPUの演算ユニットはアイドリングしているのです。上手くスケジューリングすることができればUTMのGPUコストを隠蔽することができます。
まとめ
結局、UTMに起因するデッドロックの発生の仕組みは予測の域を出ません。また、ほかにもUTMデッドロックを回避する手法はありますが、UTMブロッキングが発生すると、様々なD3DAPIがブロックされることが分かっており、マルチスレッドで動作するプログラムにおいて、これは多数のレンダリングに関連するスレッドが同時にストールする可能性を意味します。つまり、UTMブロッキングが発生している時点で、すでにプログラムとしては大きな性能の問題に直面しているのです。だとするならば、UTMデッドロックを避けるだけでなく、UTMブロッキング自体を起こさないようにアプリケーションで制御するしかないのが現状です。
APIやドライバモデルの設計から一度やり直した方がよいのではないかという気がしてきます。
以下英語版
Deadlocks Caused by ID3D12CommandQueue::UpdateTileMappings
One of the reasons for hang-ups happening infrequently in D3D12 games is a deadlock caused by UpdateTileMappings. Its precise mechanism is still unknown, but recently I’ve been able to compile my observations on this issue to be able to explain to others, so I’d like to leave this note as a memo.
However, what I will describe below is merely a guess that it could probably be happening in the system. The exact details can only be confirmed by asking the people who design the SDK and the OS. Additionally, the survey has been done with the current latest OS, Windows 11 24H2 (OS Build 26100.2894), and the issue I’m going to descrbie would be fixed in the future.
Observing the behavior of ID3D12CommandQueue::UpdateTileMappings with GPUView
Let’s use GPUView to check the behavior of UpdateTileMappings. In the GPUView’s event list, select DxgKrnl UpdateGPUVirtualAddress to identify the call sites. The following screenshot shows a section where, after rendering process for a frame has been enqueued in the process’s GPU execution queue, UpdateTileMappings (from here, we call this UTM) is called several times. During the UTM calls, we can find that the application’s thread switches to kernel mode. Also we can see that two fences are set for each UTM call.
Next, let’s observe the timing when these fences are started to be processed in the process’s GPU execution queue. First, you can see that the stacked fence objects are identical. It appears that a single fence object is used with incrimenting its fence value. When the UTM’s fence reaches the front of the process’s GPU execution queue, a DPC (Deferred Procedure Call) is invoked on the application’s thread (which can be interpreted as an OS interrupt). This DPC sends a Paging Queue Packet to the process’s paging queue. In the following screenshot, the fence object sent out by the UTMs is highlighted. Just before the head of the series of fences from the UTM reaches the front of the execution queue, a DPC is initiated on the thread indicated by the white bar of the application’s thread, then, a Paging Queue Packet seems to be sent out while the DPC is working. I have illustrated this with red arrows.
The dispatched Paging Queue Packet is processed by the OS’s VidMm Worker Thread. The OS thread that receives the packet sends a Paging Command Packet to the System Paging Context. This packet is then sent to the Hardware Copy Queue on the GPU, where it is actually processed.
In the System Paging Context, three fences are set immediately after the Paging Command Packet. It seems these are used to detect the completion of the UTM processing on the GPU side on the CPU side. One of these fences appears to trigger a DPC on the thread of the process that originally sent out the UTM. The DPC then increments the fence value of the UTM. As a result, the fence that was waiting for the UTM to complete in the process’s GPU execution queue is resolved. This means that one UTM processing is completed.
Tracking UTM Processing with Windbg
Next, let’s use a debugger to track the UTM processing. I traced a UTM call of a sample application using only Microsoft’s symbol server. The process consists of the D3D runtime, user-mode driver, and Windows API. I would like to list out some major processing steps in order.
1. Acquiring the Mutex Managed by D3D12Core
At the beginning of the UTM call, a mutex managed by D3D12Core is acquired. It is likely that this is for mutual exclusion control for calls to the same CGraphicsCommandQueue. As CGraphicsCommandQueue interface is designed to be thread-safe, it appears that the D3D runtime manages mutual exclusion control as needed.
[0x0]   ntdll!RtlAcquireSRWLockExclusive
[0x1]   msvcp_win!Mtx_lock+0x31
[0x2]   D3D12Core!std::_Mutex_base::lock+0x10
[0x3]   D3D12Core!CGraphicsCommandQueue::UpdateTileMappings+0xe2
2. Calling the Function Registered in the Device Driver Interface
The Device Driver Interface (DDI) is an interface for functions used by the OS and runtime to call device drivers. The call destination will be the code of the installed driver. Judging by the arguments of the call of the DDI, it’s clear that this is PFND3D12DDI_UPDATETILEMAPPINGS defined in d3d12umddi.h.
[0x2]   D3D12Core!TableFunctionTraits<2>::Detail::InvokerImpl<TableFunctionTraitsImpl<2>::FunctionTraits<70,0,void>,void,void,D3D12DDI_HCOMMANDQUEUE,D3D10DDI_HRESOURCE,unsigned int,D3D12DDI_TILED_RESOURCE_COORDINATE const * __ptr64,D3D12DDI_TILE_REGION_SIZE const * __ptr64,D3D12DDI_HHEAP,unsigned int,enum D3D12DDI_TILE_RANGE_FLAGS const * __ptr64,unsigned int const * __ptr64,unsigned int const * __ptr64,enum D3D12DDI_TILE_MAPPING_FLAGS>::Call<CGraphicsCommandQueue>+0x9f
[0x3]   D3D12Core!CGraphicsCommandQueue::UpdateTileMappings+0x15e
FYI, the definition of PFND3D12DDI_UPDATETILEMAPPINGS in d3d12umddi.h
typedef VOID ( APIENTRY* PFND3D12DDI_UPDATETILEMAPPINGS )( D3D12DDI_HCOMMANDQUEUE, D3D12DDI_HRESOURCE,
    UINT NumTiledResourceRegions,
    _In_reads_(NumTiledResourceRegions) const D3D12DDI_TILED_RESOURCE_COORDINATE* pResourceRegionStartCoords,
    _In_reads_opt_(NumTiledResourceRegions) const D3D12DDI_TILE_REGION_SIZE* pResourceRegionSizes,
    D3D12DDI_HHEAP, UINT NumRanges,
    _In_reads_opt_(NumRanges) const D3D12DDI_TILE_RANGE_FLAGS*,
    _In_reads_opt_(NumRanges) const UINT* pHeapStartOffsets,
    _In_reads_opt_(NumRanges) const UINT* pRangeTileCounts,
    D3D12DDI_TILE_MAPPING_FLAGS );
3. Acquiring a Critical Section in the UMD Code
A Critical Section is a synchronization object provided by Windows OS that can be used within a process. Looking at the call stack, it shows nvwgf2umx!OpenAdapter for the UMD code, but this simply indicates the offset address from an exported symbol in the UMD’s DLL, not that OpenAdapter is actually being called by the DDI call. Since we don’t have the PDB file for NVIDIA’s UMD DLL, the symbol cannot be resolved properly.
[0x0]   ntdll!RtlEnterCriticalSection
[0x1]   nvwgf2umx!OpenAdapter12+0x7e5f
[0x2]   D3D12Core!TableFunctionTraits<2>::Detail::InvokerImpl<TableFunctionTraitsImpl<2>::FunctionTraits<70,0,void>,void,void,D3D12DDI_HCOMMANDQUEUE,D3D10DDI_HRESOURCE,unsigned int,D3D12DDI_TILED_RESOURCE_COORDINATE const * __ptr64,D3D12DDI_TILE_REGION_SIZE const * __ptr64,D3D12DDI_HHEAP,unsigned int,enum D3D12DDI_TILE_RANGE_FLAGS const * __ptr64,unsigned int const * __ptr64,unsigned int const * __ptr64,enum D3D12DDI_TILE_MAPPING_FLAGS>::Call<CGraphicsCommandQueue>+0x9f
[0x3]   D3D12Core!CGraphicsCommandQueue::UpdateTileMappings+0x15e
4. Setting a Fence Signal
Next, it calls SubmitSignalSyncObjectsToHwQueueCB of D3DCore. This callback is likely registered by the OS in the D3D runtime. The registered callback function appears to be win32u!NtGdiDdDDISubmitSignalSyncObjectsToHwQueue. By checking the assembly code of this function, I found it almost immediately called a syscall to enter kernel mode. The call path up to this point is somewhat complex: Application → D3D Runtime → UMD → D3D Runtime → GDI.
[0x0]   win32u!NtGdiDdDDISubmitSignalSyncObjectsToHwQueue+0x12
[0x1]   D3D12Core!CallAndLogImpl<long (__cdecl*)(_D3DKMT_SUBMITSIGNALSYNCOBJECTSTOHWQUEUE const * __ptr64),_D3DKMT_SUBMITSIGNALSYNCOBJECTSTOHWQUEUE * __ptr64>+0x1d
[0x2]   D3D12Core!NDXGI::CDevice::SubmitSignalSyncObjectsToHwQueueCB+0xdd
[0x3]   nvwgf2umx!....
....
[0xa]   nvwgf2umx!....
[0xb]   D3D12Core!TableFunctionTraits<2>::Detail::InvokerImpl<TableFunctionTraitsImpl<2>::FunctionTraits<70,0,void>,void,void,D3D12DDI_HCOMMANDQUEUE,D3D10DDI_HRESOURCE,unsigned int,D3D12DDI_TILED_RESOURCE_COORDINATE const * __ptr64,D3D12DDI_TILE_REGION_SIZE const * __ptr64,D3D12DDI_HHEAP,unsigned int,enum D3D12DDI_TILE_RANGE_FLAGS const * __ptr64,unsigned int const * __ptr64,unsigned int const * __ptr64,enum D3D12DDI_TILE_MAPPING_FLAGS>::Call<CGraphicsCommandQueue>+0x9f
[0xc]   D3D12Core!CGraphicsCommandQueue::UpdateTileMappings+0x15e
FYI the code snippet of NtGdiDdDDISubmitSignalSyncObjectsToHwQueue
win32u!NtGdiDdDDISubmitSignalSyncObjectsToHwQueue:
mov     r10, rcx
mov     eax, 125Dh
test    byte ptr [7FFE0308h], 1
jne     win32u!NtGdiDdDDISubmitSignalSyncObjectsToHwQueue+0x15
syscall
ret
5. Calling D3DKMT_UPDATEGPUVIRTUALADDRESS
Finally, we have reached the core processing part of UTM. The call path is similar to that of the signaling the fence mentioned earlier. This is also a GDI function, and it immediately executes a syscall within the function. The actual processing seems to be in kernel mode.
[0x0]   win32u!NtGdiDdDDIUpdateGpuVirtualAddress+0x12
[0x1]   D3D12Core!CallAndLogImpl<long (__cdecl*)(_D3DKMT_UPDATEGPUVIRTUALADDRESS const * __ptr64),_D3DKMT_UPDATEGPUVIRTUALADDRESS * __ptr64>+0x11
[0x2]   D3D12Core!NDXGI::CDevice::UpdateGpuVirtualAddressCB+0x64
[0x3]   nvwgf2umx!....
....
[0x8]   nvwgf2umx!....
[0x9]   D3D12Core!TableFunctionTraits<2>::Detail::InvokerImpl<TableFunctionTraitsImpl<2>::FunctionTraits<70,0,void>,void,void,D3D12DDI_HCOMMANDQUEUE,D3D10DDI_HRESOURCE,unsigned int,D3D12DDI_TILED_RESOURCE_COORDINATE const * __ptr64,D3D12DDI_TILE_REGION_SIZE const * __ptr64,D3D12DDI_HHEAP,unsigned int,enum D3D12DDI_TILE_RANGE_FLAGS const * __ptr64,unsigned int const * __ptr64,unsigned int const * __ptr64,enum D3D12DDI_TILE_MAPPING_FLAGS>::Call<CGraphicsCommandQueue>+0x9f
[0xa]   D3D12Core!CGraphicsCommandQueue::UpdateTileMappings+0x15e
FYI, the code snippet of NtGdiDdDDIUpdateGpuVirtualAddress
win32u!NtGdiDdDDIUpdateGpuVirtualAddress:
mov     r10, rcx
mov     eax, 1264h
test    byte ptr [7FFE0308h], 1
jne     win32u!NtGdiDdDDIUpdateGpuVirtualAddress+0x15 (7ff81e415f15)
syscall
ret
6. Setting Fence Waits
After D3DKMT_UPDATEGPUVIRTUALADDRESS is called, it sets some fence waits from the UMD code in my environment. This processing is also handled by a GDI function executed in kernel mode.
[0x0]   win32u!NtGdiDdDDISubmitWaitForSyncObjectsToHwQueue+0x12
[0x1]   D3D12Core!CallAndLogImpl<long (__cdecl*)(_D3DKMT_SUBMITWAITFORSYNCOBJECTSTOHWQUEUE const * __ptr64),_D3DKMT_SUBMITWAITFORSYNCOBJECTSTOHWQUEUE * __ptr64>+0x1d
[0x2]   D3D12Core!NDXGI::CDevice::SubmitWaitForSyncObjectsToHwQueueCB+0x4d
[0x3]   nvwgf2umx!...
...
[0xa]   nvwgf2umx!...
[0xb]   D3D12Core!TableFunctionTraits<2>::Detail::InvokerImpl<TableFunctionTraitsImpl<2>::FunctionTraits<70,0,void>,void,void,D3D12DDI_HCOMMANDQUEUE,D3D10DDI_HRESOURCE,unsigned int,D3D12DDI_TILED_RESOURCE_COORDINATE const * __ptr64,D3D12DDI_TILE_REGION_SIZE const * __ptr64,D3D12DDI_HHEAP,unsigned int,enum D3D12DDI_TILE_RANGE_FLAGS const * __ptr64,unsigned int const * __ptr64,unsigned int const * __ptr64,enum D3D12DDI_TILE_MAPPING_FLAGS>::Call<CGraphicsCommandQueue>+0x9f
[0xc]   D3D12Core!CGraphicsCommandQueue::UpdateTileMappings+0x15e
win32u!NtGdiDdDDISubmitWaitForSyncObjectsToHwQueue:
mov     r10, rcx
mov     eax, 125Eh
test    byte ptr [7FFE0308h], 1
jne     win32u!NtGdiDdDDISubmitWaitForSyncObjectsToHwQueue+0x15 (7ff81e415e55)
syscall
ret
7. Releasing the Critical Section Acquired in the UMD Code
The UMD acquired a critical section at the beginning, which is now being released.
[0x0]   ntdll!RtlLeaveCriticalSection
[0x1]   nvwgf2umx!...
[0x2]   D3D12Core!TableFunctionTraits<2>::Detail::InvokerImpl<TableFunctionTraitsImpl<2>::FunctionTraits<70,0,void>,void,void,D3D12DDI_HCOMMANDQUEUE,D3D10DDI_HRESOURCE,unsigned int,D3D12DDI_TILED_RESOURCE_COORDINATE const * __ptr64,D3D12DDI_TILE_REGION_SIZE const * __ptr64,D3D12DDI_HHEAP,unsigned int,enum D3D12DDI_TILE_RANGE_FLAGS const * __ptr64,unsigned int const * __ptr64,unsigned int const * __ptr64,enum D3D12DDI_TILE_MAPPING_FLAGS>::Call<CGraphicsCommandQueue>+0x9f
[0x3]   D3D12Core!CGraphicsCommandQueue::UpdateTileMappings+0x15e
8. Releasing the Mutex managed by D3DCore
At the end, D3D runtime releases the mutex that was acquired at the beginning of the UMD.
[0x0]   ntdll!RtlReleaseSRWLockExclusive   0xc9a75ffd18   0x7ff81e8a366b
[0x1]   msvcp_win!Mtx_unlock+0x1b   0xc9a75ffd20   0x7fff94976bd8
[0x2]   D3D12Core!CGraphicsCommandQueue::UpdateTileMappings+0x168   0xc9a75ffd50   0x7ff6e60e183d
Summary of the UTM Behavior
- Acquiring a mutex (managed by the D3D runtime) likely for mutual exclusion control per CommandQueue object.
- Acquiring a critical section within UMD code. (This may vary depending on the GPU or driver used.)
- Calling the following GDI functions. (Most of the processing for these functions are in kernel mode.)
NtGdiDdDDISubmitSignalSyncObjectsToHwQueueNtGdiDdDDIUpdateGpuVirtualAddressNtGdiDdDDISubmitWaitForSyncObjectsToHwQueue
Specifications of D3DKMTUpdateGpuVirtualAddress
The last part of the remarks section on the page above says important information.
Drivers can submit many UpdateGpuVirtualAddress calls, which will be queued behind the rendering fence. When the number of queued update operations exceeds 128, the calling thread will be blocked until the previous operations are processed by the video memory manager.
That is to say, since UTM is a method of ID3D12CommandQueue, we might imagine that even issuing a large number of UTM processes would only result in them being accumulated in the CommandQueue. However, in reality, only up to 128 requests can be accumulated, and once a UTM call touches this limit, the processing is blocked until the UTMs issued earlier are completed.
Deadlock Conditions of UTM
The deadlock of UTM is likely caused by the blocking of UTM processing due to the accumulation of more than 128 UTM processes, as described earlier. This blocking can only be resolved when the previously issued UTM processes are completed on the GPU. Because UTM is a method of ID3D12CommandQueue, the UTM processing will not start until all processes enqueued before the UTM are completed and the fence to start the UTM processing is signaled. If a wait of a fence is set before enqueuing the UTM and it is not resolved, a deadlock is expected to occur.
However, generally, a situation where the wait of a fence is not resolved can lead to a deadlock regardless of the UTM operations, so it cannot be said to be a UTM-specific problem. So, what is unique to UTM is where the blocking to wait for the completion of the previously issued UTM processing is performed.
By examining some memory dumps of processes in UTM deadlock situations, we can see that the blocking occurs during the processing within the syscall in win32u!NtGdiDdDDIUpdateGpuVirtualAddress, which means it is blocking in kernel space.
In the previous chapter, when we traced UTM processing with WinDbg, we confirmed that before reaching this point, the mutex in D3D12Core and the Critical Section in UMD are secured. Additional exclusive processing might also be performed in the kernel space of the GDI layer. If these exclusive processes blocks to signal a wait fence set on the queue before calling the UTM, a deadlock will occur.
It’s natural to wonder if such a thing could actually happen. However, in the next chapter, I believe you will be convinced when you see the list of other APIs that are blcoked during UMT blocking.
APIs that conflict with UTM
Let’s take a look at other API calls that stops during UTM blocking. The mutex in D3DCore and the critical section in UMD can be observed to conflict with a debugger. However, examining dumps of processes that stopped with UTM deadlocks reveals that exclusive processing also seems to exist in the GDI functions performed in kernel space. Here, I want to list the functions frequently observed in the dumps of processes where UTM deadlocks occurred, meaning the functions that likely be blocked due to UTM blocking.
ID3D12CommandQueue::ExecuteCommandLists
In my experience, this is most frequently observed. Within D3DCore, the attempt to acquire a mutex fails, causing the thread to sleep and wait in NtWaitForAlertByThreadId. If this mutex is secured by UTM, it is likely bound to the same CommandQueue, so it makes sense that the API call is blocked to acquire the mutex and enter a wait state. So, this ECL should be queued after the UTM, and it shouldn’t be the direct cause of a deadlock caused by UTM.
ID3D12CommandQueue::Signal
This is observed to call NtGdiDdDDISubmitSignalSyncObjectsToHwQueue from D3DCore directly to Win32u and stopped within the syscall. A deadlock should occur if a signal fence set on another queue to signal the wait fence set on the UTM queue cannot be set.
It is really interesting that the thread calling the signal is halted within the syscall.
ID3D12Fence::SetEventOnCompletion
This API calls the method D3D12Core!CFence::SetEventOnCompletion from D3D12Core!CDevice::SetEventOnMultipleFenceCompletion. Therefore, although the API is classified as ID3D12Fence, it seems more appropriate to consider it as a process of ID3D12Device. Ultimately, it calls NtGdiDdDDIWaitForSynchronizationObjectFromCpu and stooped in the syscall.
ID3D12Device::CreatePlacedResource
In my environment, this method calls D3D12Core!NDXGI::CDevice::UpdateGpuVirtualAddressCB from UMD, and ultimately calls NtGdiDdDDIUpdateGpuVirtualAddress. It follows the same code path as ID3D12CommandQueue::UpdateTileMappings. Since it involves the same kernel call as UTM, it is understandable that it conflicts.
ID3D12Fence::Release()
The most surprising observation was the release of a fence object. This process ultimately calls NtGdiDdDDIDestroySynchronizationObject. I’ve seen the API stopped in the syscall of it multiple times.
How Should We Avoid UTM deadlocks?
Limit and Manage number of in-flight UTMs.
There may be some ways to avoid UTM deadlock, but I propose one of the most effective methods. That is to monitor and control the number of UTM issues on the application side. The method involves preparing a dedicated CPU thread, a dedicated copy queue, and a dedicated fence for processing UTMs. After calling a UTM, set a signal and increment its fence value. Before calling UTM, check the completion status on the GPU side with GetCompletedValue(), and if it appears that more than 128 requests are likely to be queued, use SetEventOnCompletion() to wait for the completion of previously issued UTMs. This way, you can prevent more than 128 UTMs from piling up on the command queue. If synchronization with a GraphicsQueue or ComputeQueue is necessary, set a fence between them as needed for synchronization.
Why Prepare a Dedicated Thread
First of all, it is natural to prepare a dedicated thread, considering the situation where the thread may need to wait with SetEventOnCompletion(). In addition, the UTM call inherently involves CPU-side fence processing. It is expected that many DPC calls will occur as observed in GPU View. These processings may potentially steal CPU time and disturb L1 cache state from the caller thread. Therefore, the UTM calls should be in a thread specialized for UTM processing.
Why Prepare a Dedicated Copy Queue
The primary reason for using a dedicated copy queue is to accurately count the number of UTMs. The condition of UTM blocking with 128 is based on the number per command queue, not the total number issued within the process. As an extreme example, if you prepare two command queues and evenly distribute UTM requests, you can issue up to 256 UTMs.
Preparing a dedicated queue and synchronizing with other queues using a fence might initially seem like a high-overhead process. However, UTM processing inherently involves operations by the OS memory manager and synchronizes with the queue issued by the UTM using a fence. In other words, it is inherently a high-overhead process.
If you synchronize with other graphics queues or compute queues using a fence, those queues will ultimately wait for the UTM queue. The overall throughput may not change. However, if you find that the graphics queue or compute queue is waiting for the UTM queue for a long time, you may want to adjust the timings of the fence synchronizing with the UTM queue, or, insert other non-dependent processes for optimization.
FYI, UTM processing is handled in a very short time on the hardware copy queue on the GPU. This means that during UTM processing, the GPU’s compute units are idling. Proper scheduling has a possibility to hide the GPU cost of UTM.
Summary
In the end, the mechanism behind deadlocks caused by UTM remains speculative. There are other methods to avoid UTM deadlocks, but when UTM blocking occurs, we found that various D3D APIs are blocked. In a multi-threaded program, this means that many threads related to rendering could stall simultaneously. In other words, once UTM blocking occurs, the program is already facing significant performance issues. Therefore, it is not only necessary to avoid UTM deadlocks but also to control the application to prevent UTM blocking itself. I hope it will be solved in the OS in the future.
shikihuiku
リアルタイムレンダリングが好き